The
Numbers
The Air District strives topromote practices that supportdiversity, equity and inclusionin the workplace and thebroader community.
Bay Area Demographics
by
Gender
5 year
Average
Ages 18 — 64*
Air District Staff
Demographics
by Gender
2021
2020
2019
2018
2017
Male
Female
*American Community Survey (ACS) Census Bureau
Bay Area Demographics
by
Race and Ethnicity**
5 year
Average
Ages 18 — 64*
Air District Staff|Demographicsby Race|and Ethnicity**
2021
2020
2019
2018
2017
WHITE
ASIAN
HISPANIC
BLACK
OTHER / UNKNOWN
AMERICAN INDIAN / ALASKAN NATIVE
*American Community
Survey (ACS) Census Bureau
**Total percentages may vary by 1% due to rounding
Sources of Greenhouse|Gas Emissionsa, b
TRANSPORTATION
INDUSTRIAL
ELECTRICITY / CO-GENERATION
RESIDENTIAL / COMMERCIAL FUEL USAGE
HIGH GLOBAL WARMING POTENTIAL GASES
RECYCLING AND WASTE
AGRICULTURE / FARMING
Sources of Annual Fine|Particulate Pollutionb, c
21.4%
18.3%
16.5%
12.0%
10.8%
8.6%
7.6%
4.2%
0.6%
Sources of Annual|Nitrogen Oxide|Pollutionb, c
53.4%
28.5%
16.0%
2.1%
b) The percentage estimates were developed based on the Air District’s currently available base year inventory data. These estimates do not reflect specific emissions changes in year 2021 from COVID-19 and wildfires.
c) The Air District is in the process of updating the base year inventory to reflect changes in recent state and local regulations and emissions data.
d) This category includes aircraft, ships, trains, construction equipment and other off-road equipment.
e) This category includes industrial and commercial processes other than fuels combustion.
2021 Revenue
TOTAL
$ 206413174
2021 Revenue
$ 105,581,725
State and Other Grants
$ 56,376,275
Permit-Related Revenue
$ 39,778,798
County Property Tax
$ 3,612,624
Federal Grants
$ 1,063,752
Other Revenue
2021 Expenditures
$84,506,530
Program Distribution
$78,508,161
Personnel
$28,828,722
Services and Supplies
$3,501,905
Capital Outlay
2021 Expenditures
TOTAL
$ 195345318
4,711
total complaints in 2021
2021 Air Pollution|Complaints
2,499
1,358
202
194
180
159
119
2021 PERMITTING ACTIVITY
BAY AREA PERMITTED FACILITIES
Refineries 5
Major Facilities (Excludes Refineries) 77
Gasoline Dispensing Facilities 2,286
All Other Facilities 8,103
Total Permitted Facilities 10,471
Permitted Devices and Operations 26,519
NEW PERMIT APPLICATIONS
Major Source Review (Title V) 74
New Source Review (NSR) 1,071
All other applications 26
Total New Permit Applications 1,171
HEALTH RISK SCREENING ANALYSES
Diesel Engines 166
Gasoline Dispensing Facilities 12
Other Commercial/Industrial Facilities 70
Hydrogen Sulfide Modeling 1
Total Health Risk Screening Analyses 249
FACILITY HEALTH RISK SCREENING ANALYSES
Preliminary 2
Draft 1
Final 0
Total Facility Health Risk Screening Analyses 3
RULEMAKING ACTIVITY
RULES ADOPTED OR AMENDED IN 2021
JUNE 16, 2021
Regulation 3: Fees - amendments adopted
JULY 21, 2021
Rule 6-5: Particulate Emissions from Petroleum Refinery Fluidized Catalytic Cracking Units - amendments adopted
NOVEMBER 3, 2021
“Refinery” Definition - amendments adopted
Regulation 3: Fees
Rule 6-5
Rules 8-1, 8-5, 8-6, 8-7, 8-8, 8-9, 8-10, 8-18, 8-28, 8-33, 8-39, 8-44, 8-53
Rules 9-1, 9-10: Inorganic Compounds
Rule 11-10: Hazardous Pollutants
Rules 12-11, 12-12, 12-15: Misc. Standards of Performance
DECEMBER 15, 2021
Regulation 2: Permits - amendments adopted
Rule 2-1: General Requirements
Rule 2-5: Toxic New Source Review
2021 CIVIL PENALTIES AND VIOLATIONS
BAY AREA PERMITTED FACILITIES
Civil Penalties $4,265,165
Violations Resolved with Penalties 658
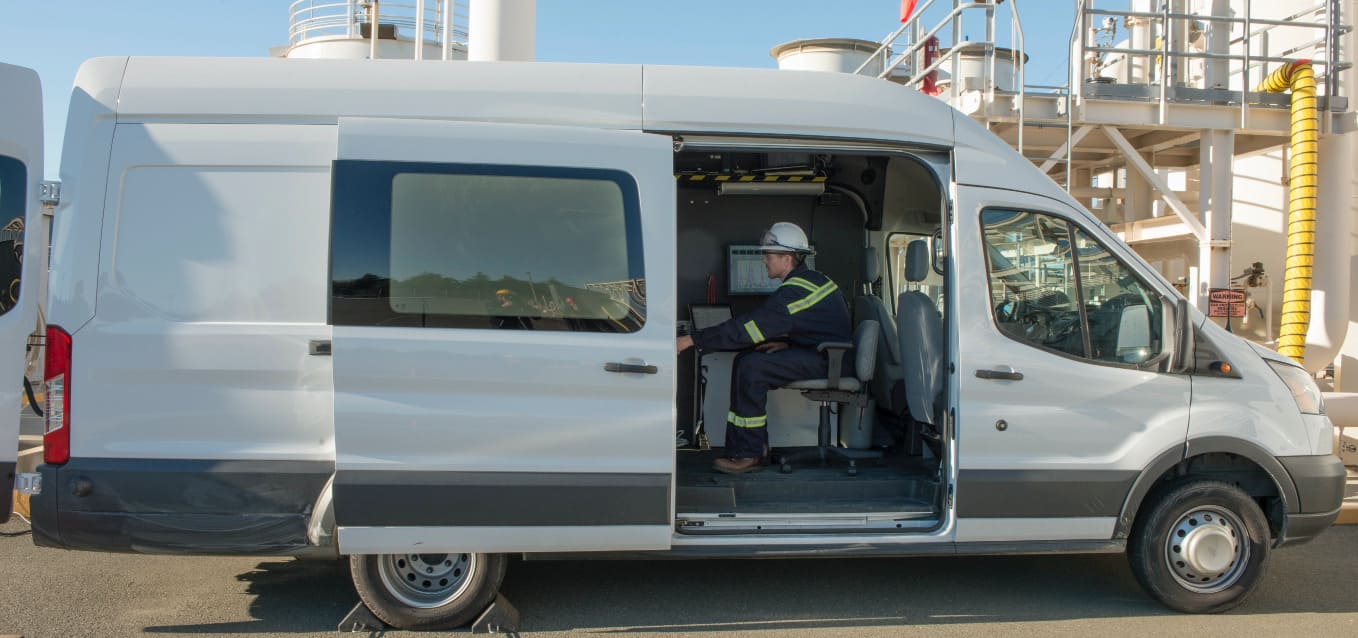
2021 COMPLIANCE AND ENFORCEMENT ACTIVITY
COMPLIANCE INSPECTIONS
Source Inspections 7,436
Air Pollution Complaints (Excludes Smoking Vehicles) 4,711
Gasoline Dispensing Facility Inspections 1,167
Asbestos Inspections 2,090
Reportable Compliance Activities 703
Diesel Compliance and Grant Inspections 419
Total Compliance Inspections 16,526
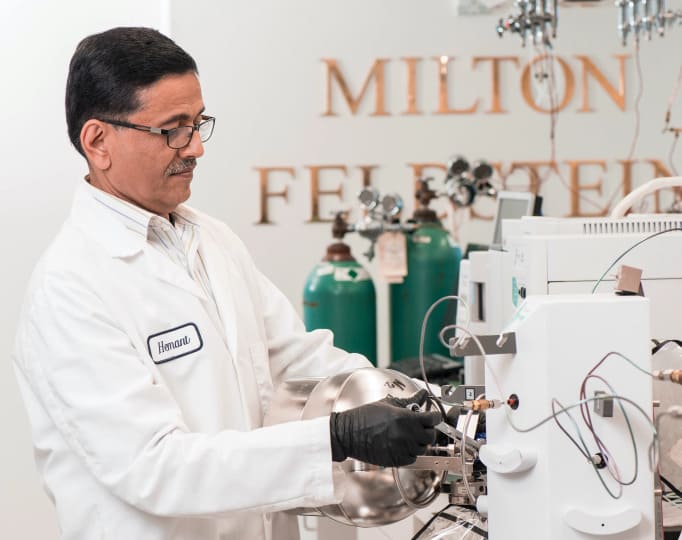
LABORATORY
2021 ANALYSES PERFORMED IN THE LAB
Samples provide information about pollutant levels in ambient air, which help to identify areas for further reductions.
Particulate Matter 3,748
Toxics 1,419
Source-Oriented Analyses 0
Interagency and Development Projects 29
Total 5,196
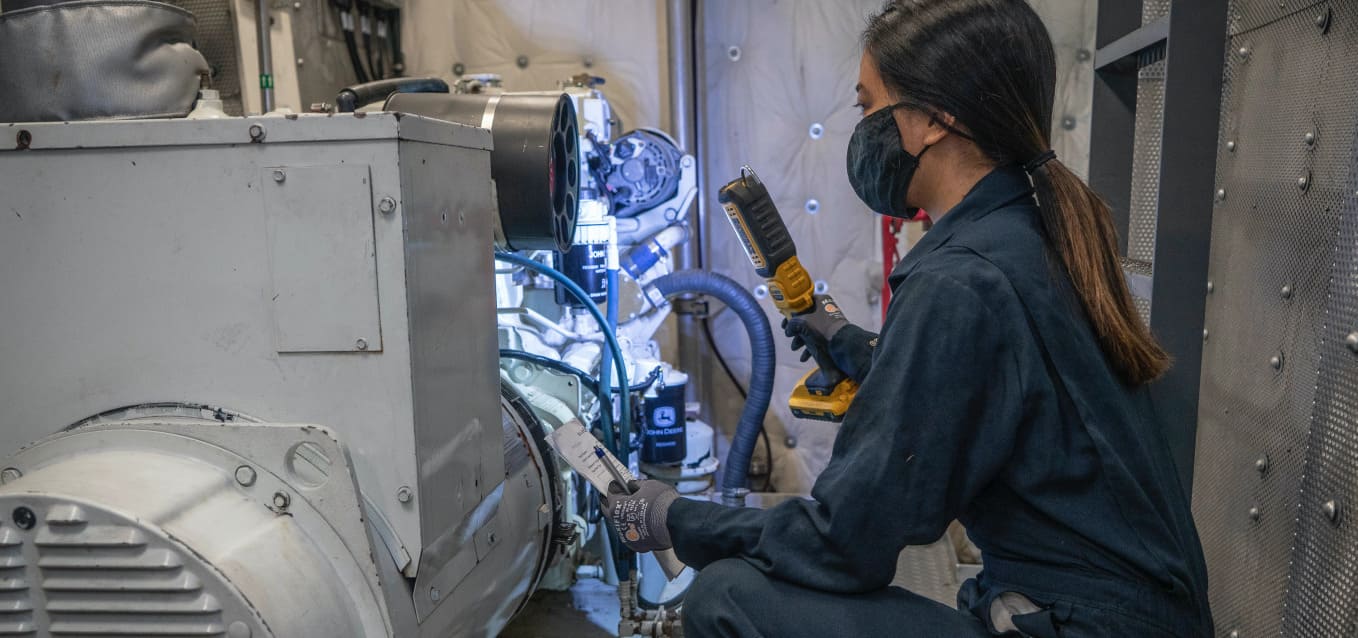
SOURCE TEST ACTIVITY
NUMBER OF SOURCE TESTS IN 2021
Refinery Source Tests 3
Compliance Rate 100%
Title V Source Tests (Excludes Refineries) 9
Compliance Rate 100%
Non-Title V Source Tests 29
Compliance Rate 82.8%
Gasoline Cargo Tanks 10
Compliance Rate 90.0%
Gasoline Dispensing Facilities 124
Compliance Rate 58.9%
Other Misc. Source Tests (contractors) 17,352
Compliance Rate 99.6%
Total Source Tests 17,527
Total Violations 84
Compliance Rate 99.5%
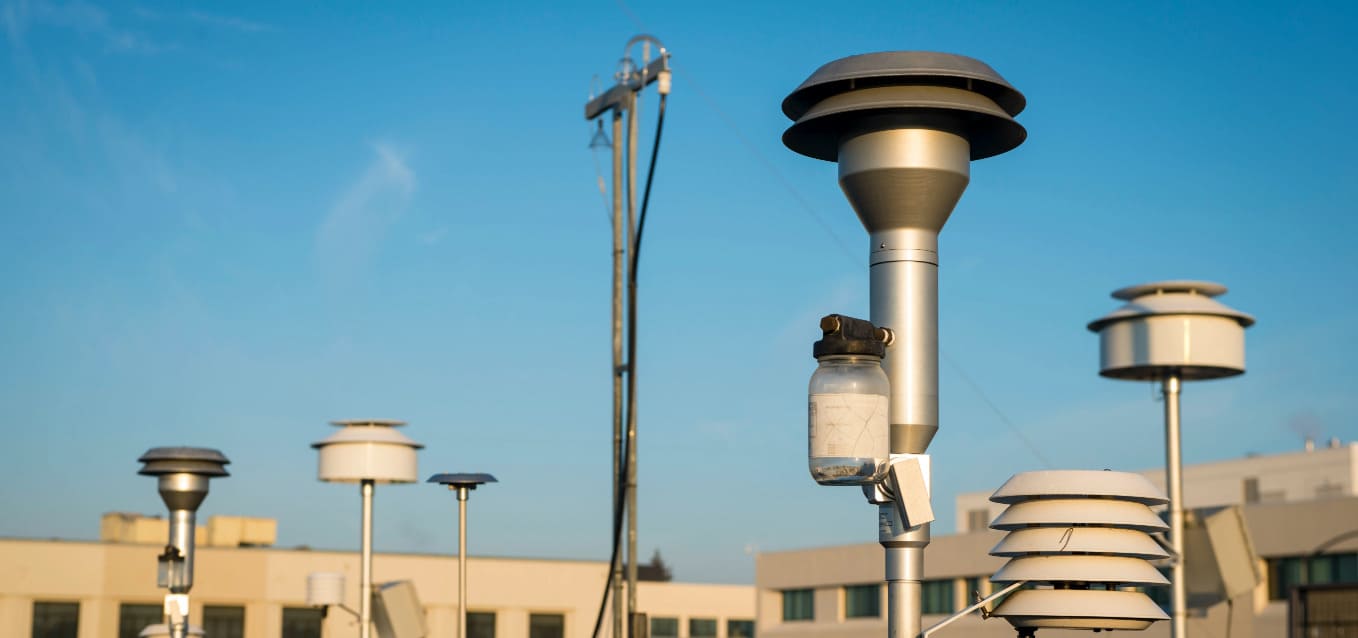
2021 EXCEEDANCES OF AIR QUALITY STANDARDS
Final certification of exceedance data will occur May 1, 2022.
OZONE
Days over National 8-Hour Standard - 9
Days over California 1-Hour Standard - 5
Days over California 8-Hour Standard - 9
PARTICULATE MATTER
Days over National 24-Hour PM10 Standard – 0*
Days over California 24-Hour PM10 Standard – 0*
Days over National 24-Hour PM2.5 Standard – 2
* Pending final certification of exceedance data
2021 Emission|Reductions fromAir|District Incentive|Projects
OFF-ROAD EQUIPMENT AND INFRASTRUCTURE
TOTAL FUNDS AWARDED $23.7M
ESTIMATED ANNUAL EMISSIONS REDUCTION FOR THE PROJECTS FUNDED (TONS/YEAR)
Oxides of Nitrogen (NOx) 118.7
Reactive Organic Compounds (ROG) 10.9
Particulate Matter (PM10) 4.6
Total 134.2
OTHER PROJECTS (INCLUDING TRIP REDUCTION)
TOTAL FUNDS AWARDED $5M
ESTIMATED ANNUAL EMISSIONS REDUCTION FOR THE PROJECTS FUNDED (TONS/YEAR)
NOx 5.7
ROG 6.6
PM10 15.5
Total 27.8
ON-ROAD VEHICLES AND INFRASTRUCTURE
TOTAL FUNDS AWARDED $36.2M
ESTIMATED ANNUAL EMISSIONS REDUCTION FOR THE PROJECTS FUNDED (TONS/YEAR)
NOx 64.4
ROG 5.6
PM10 20.7
Total 90.7
CONGESTION MANAGEMENT AGENCY PROJECTS
TOTAL FUNDS AWARDED $10.2M
ESTIMATED ANNUAL EMISSIONS REDUCTION FOR THE PROJECTS FUNDED (TONS/YEAR)
NOx 18.1
ROG 18.3
PM10 46.4
Total 82.8