.png)
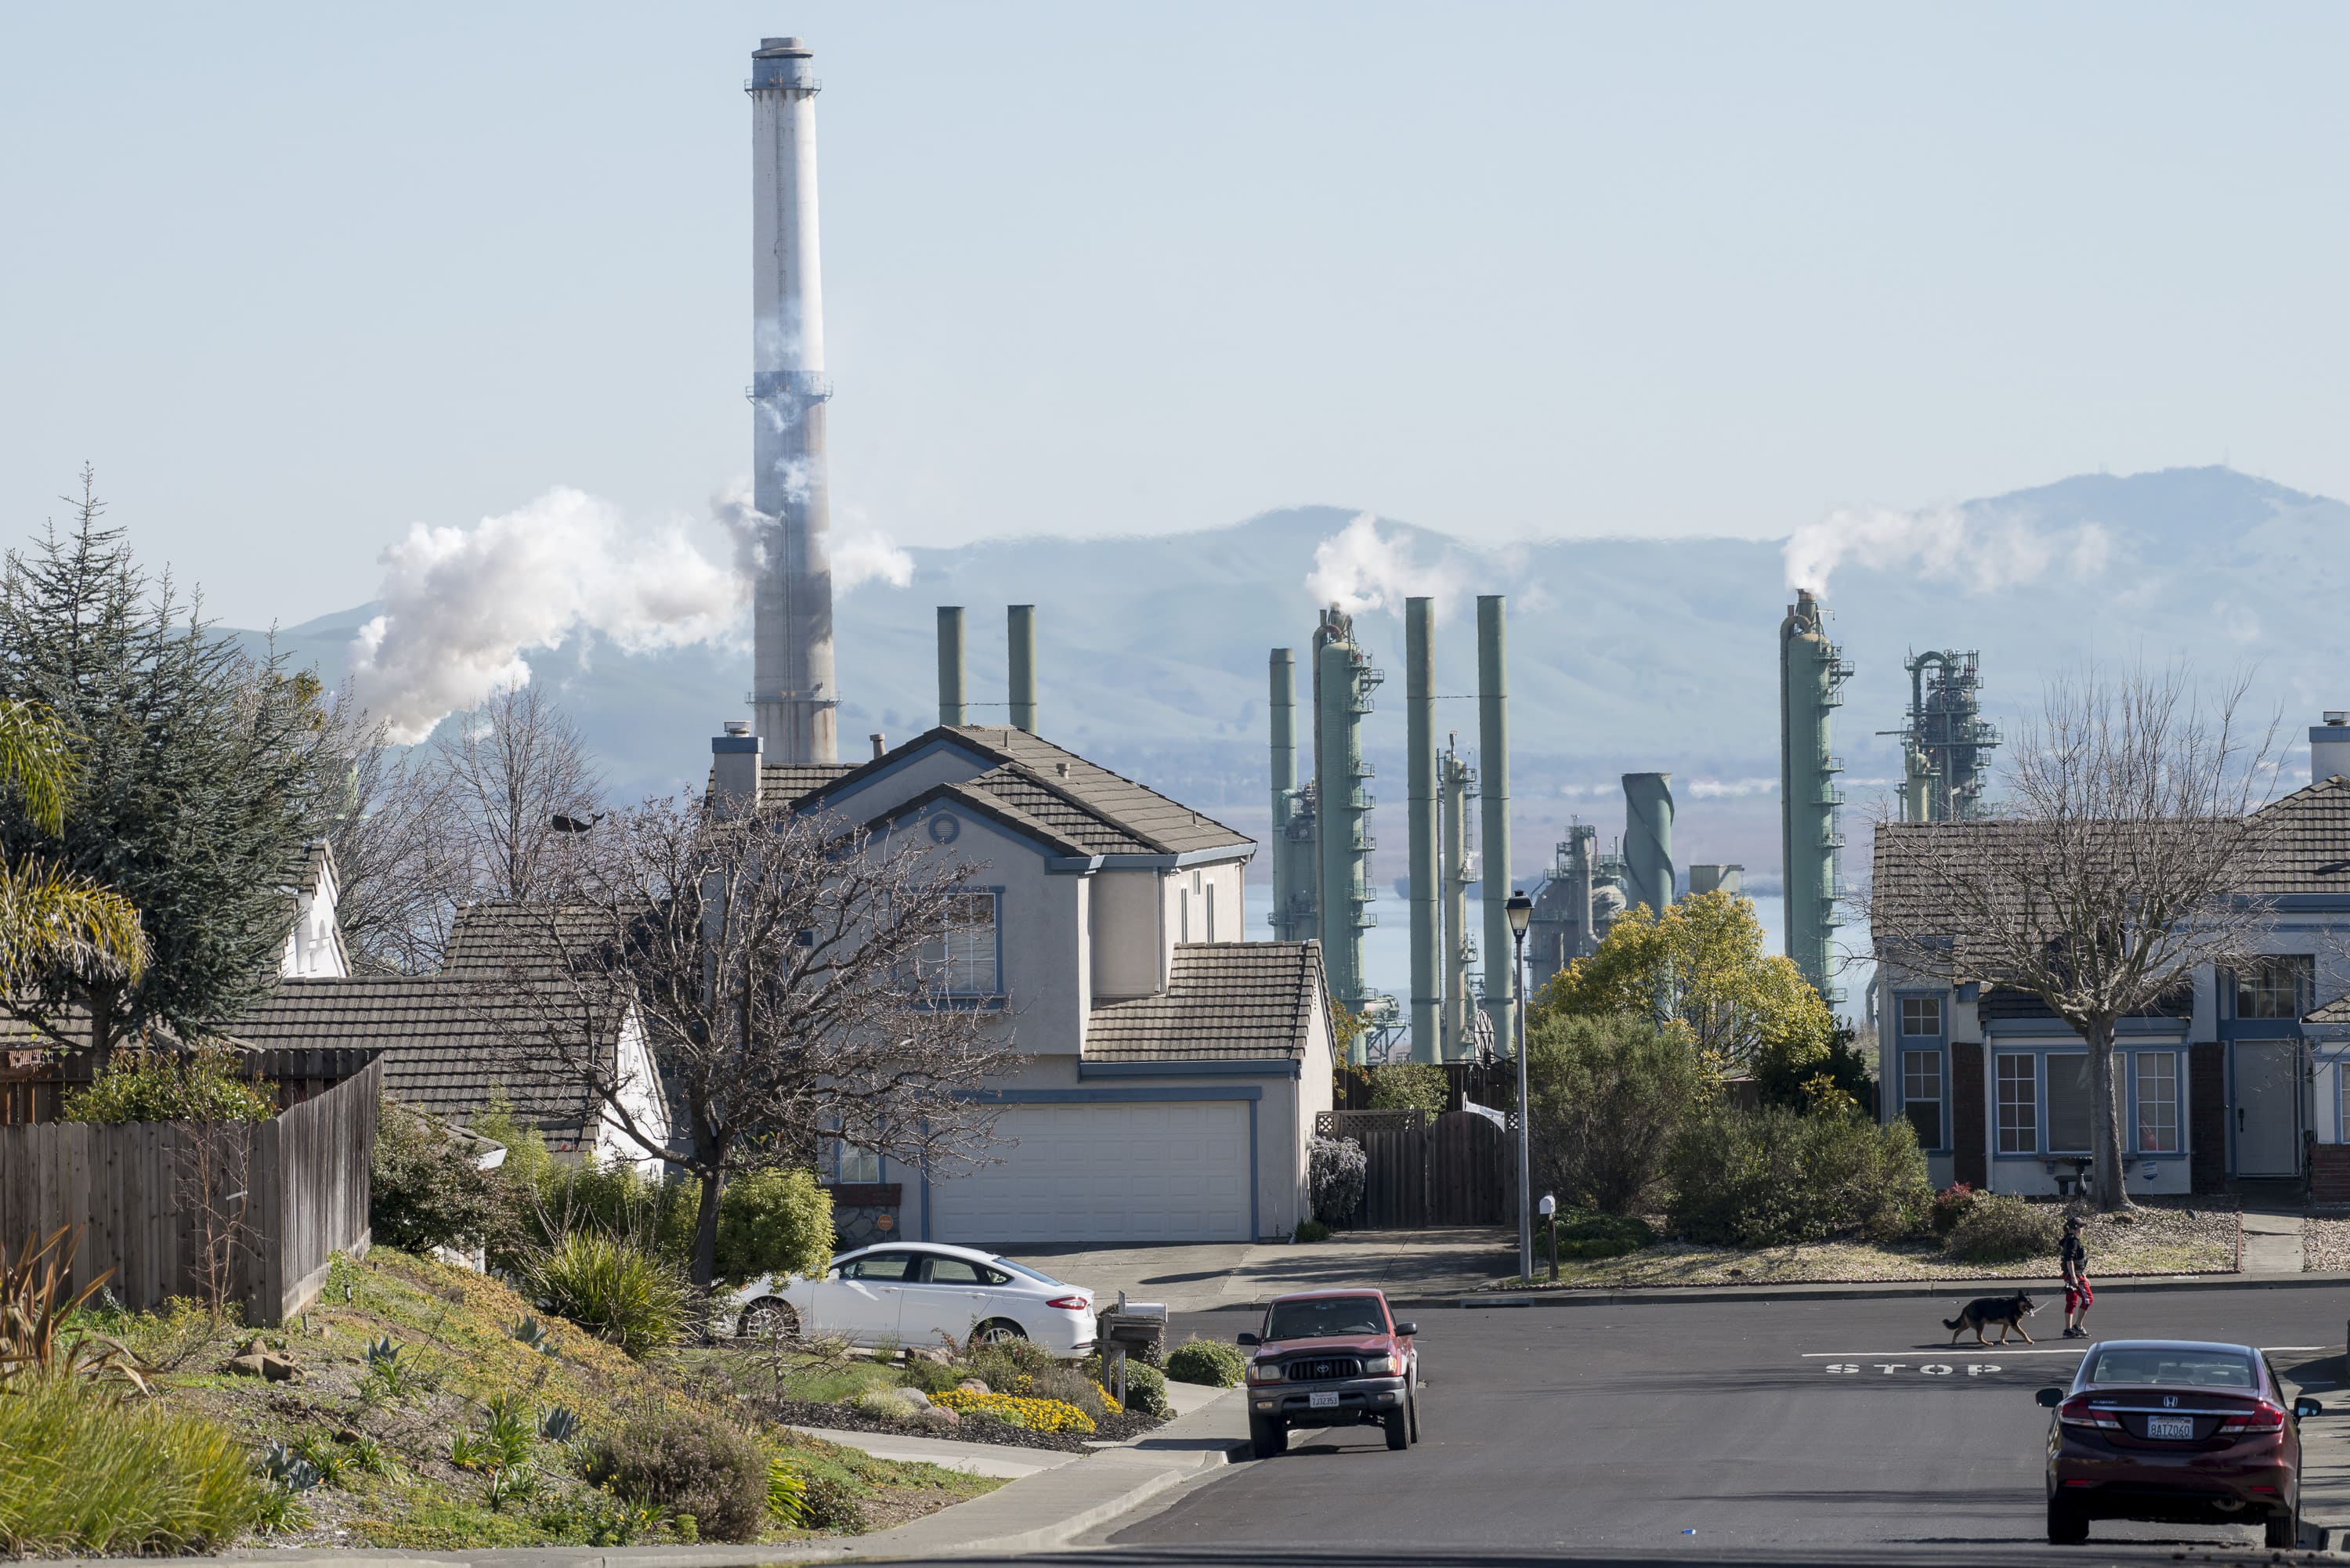
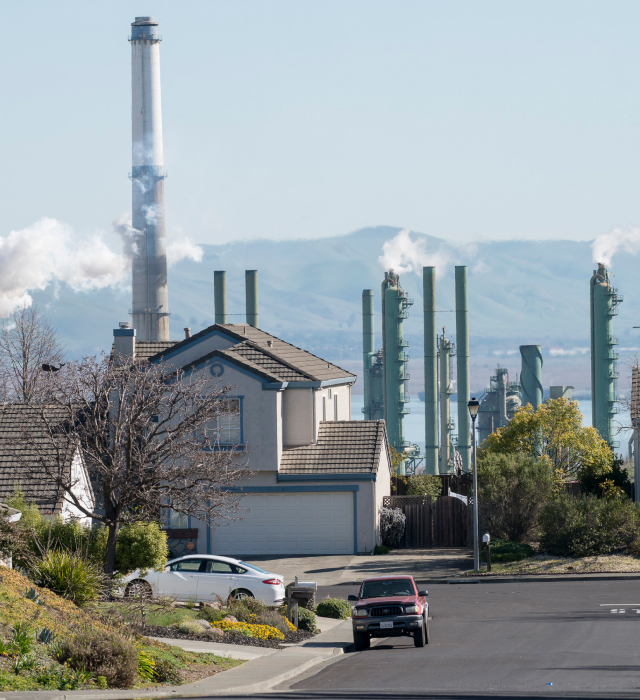
Air quality
How Do We Track Air Quality?
AIR DISTRICT MONITORING SITES
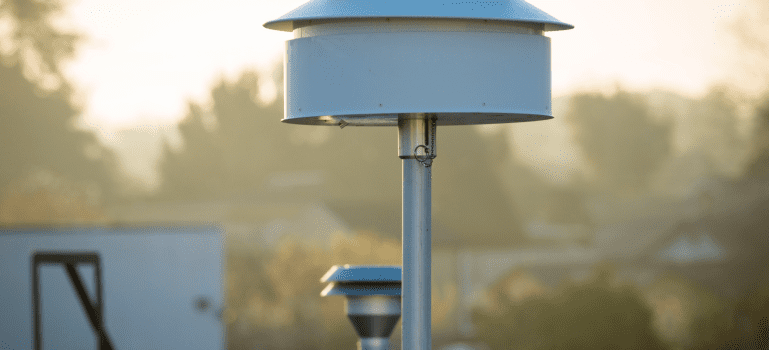
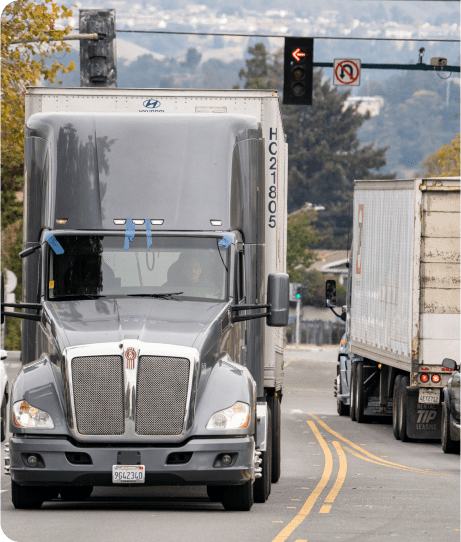
Our air monitoring network
measures concentrations of ground-level pollutants
using monitoring methods set by the U.S. Environmental Protection Agency and other state-of-the-art instruments. This data tracks trends in air pollution levels, demonstrates compliance with health-based air quality standards, and informs air quality forecasts, regional and local air quality plans, air quality modeling, and research on the health effects of air pollution.
Pollutants measured by the monitoring network include ozone, carbon monoxide, nitrogen oxides, sulfur dioxide, particulate matter, ultrafine particulate matter, lead, black carbon, hydrogen sulfide, and volatile organic compounds, including many toxic air contaminants. We also monitor for ozone precursors and the composition of particles, which improve our understanding of high ozone and particulate matter events.
AIR MONITORING SITES
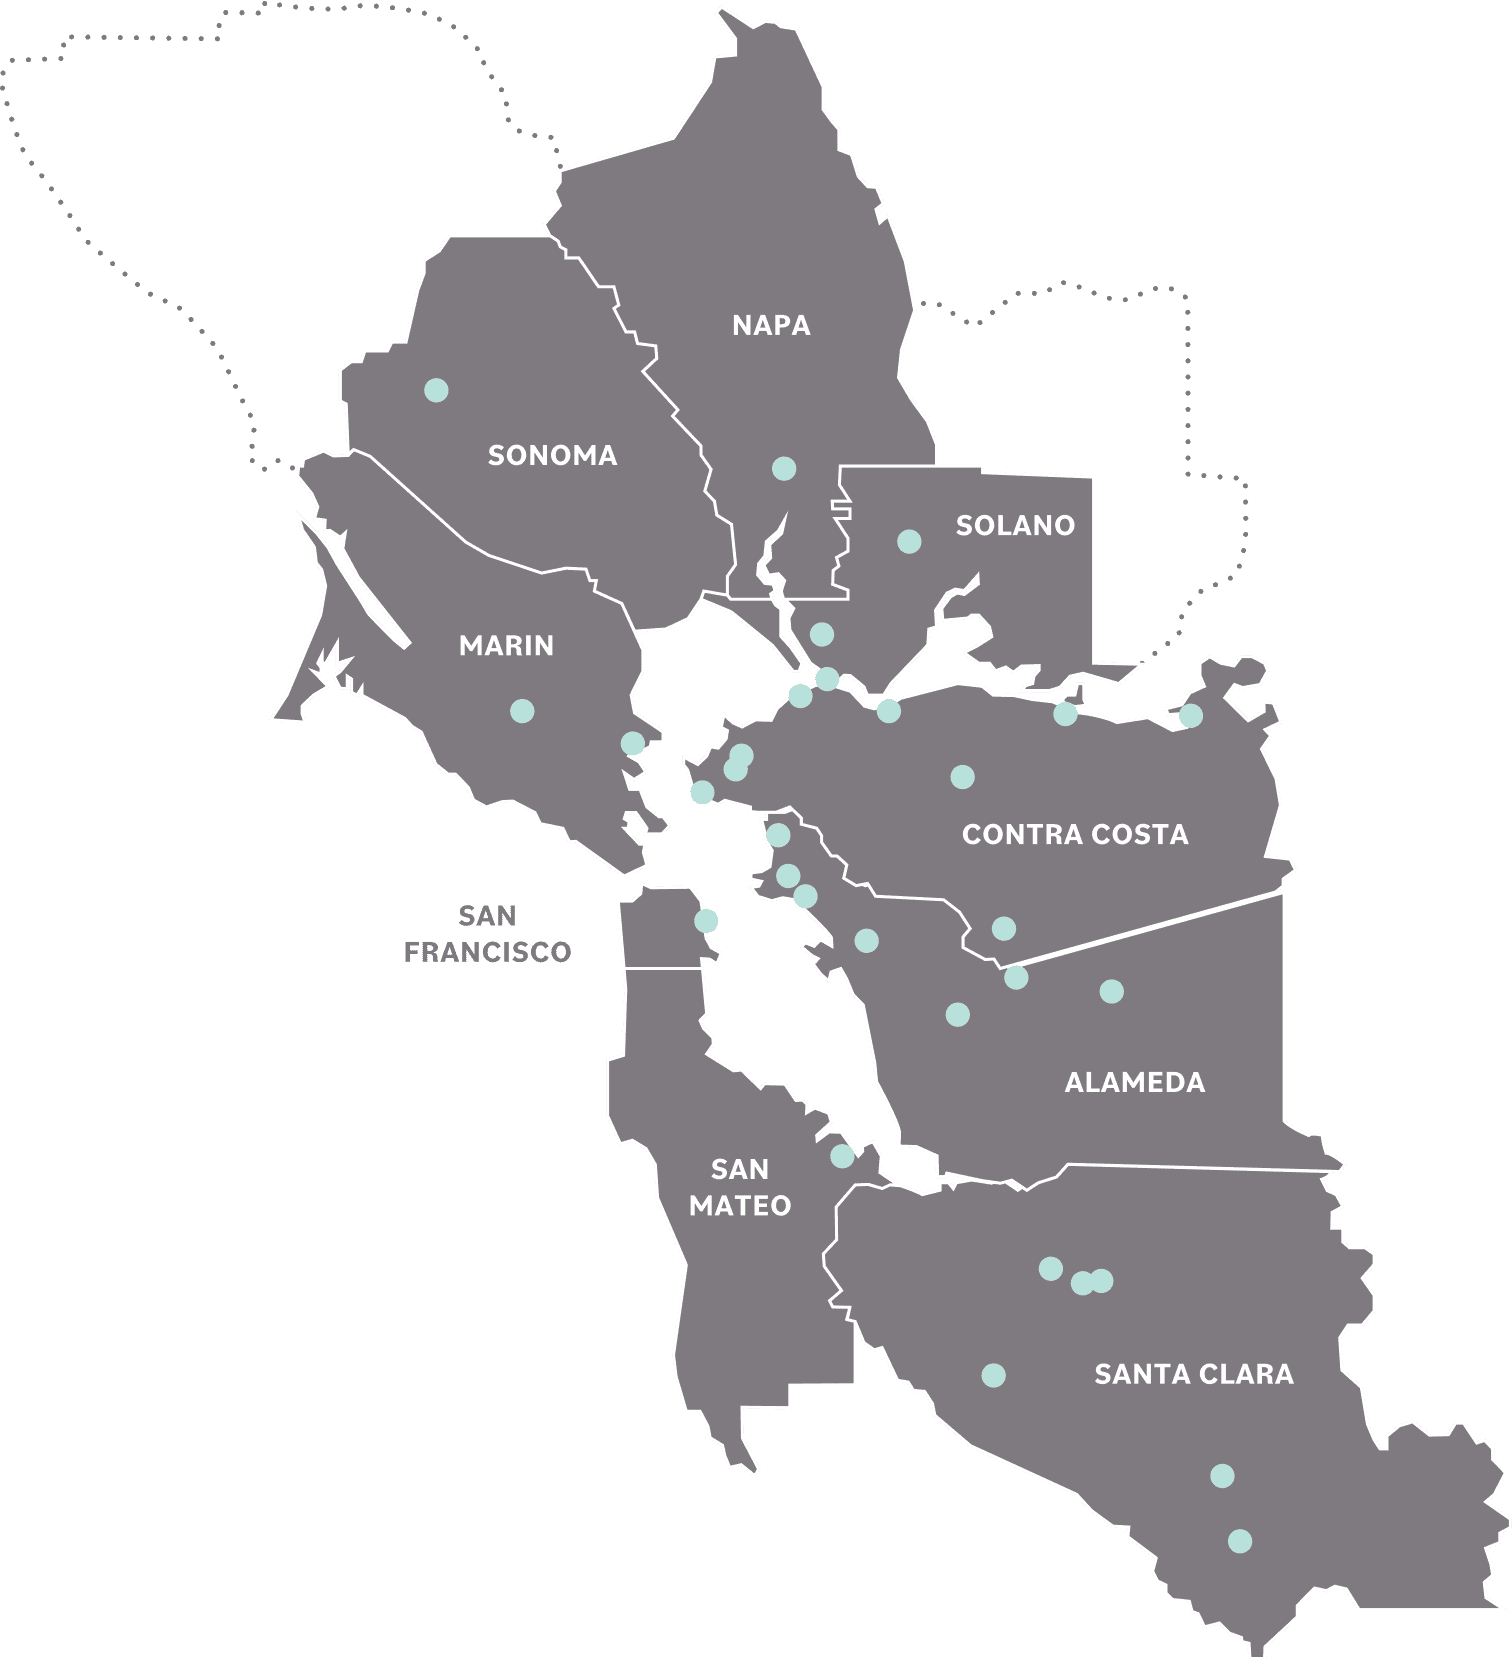
31
total air monitoring sites across the Bay Area
132
different pollutants are measured by our monitoring network
“
Our air monitoring network measures ground-level pollutants
EPA Health Standards for Particulate Matter
We fully supported the EPA’s lowering of the National Ambient Air Quality Standards (NAAQS) for particulate matter pollution. The NAAQS are designed to protect public health to an adequate margin of safety and protect the public against adverse effects. Exposure to fine particulate matter is an important driver of health risk throughout the Bay Area and is linked to serious respiratory illnesses and increased risk of heart attacks. Exposure is especially harmful for children, the elderly, and those with respiratory conditions.
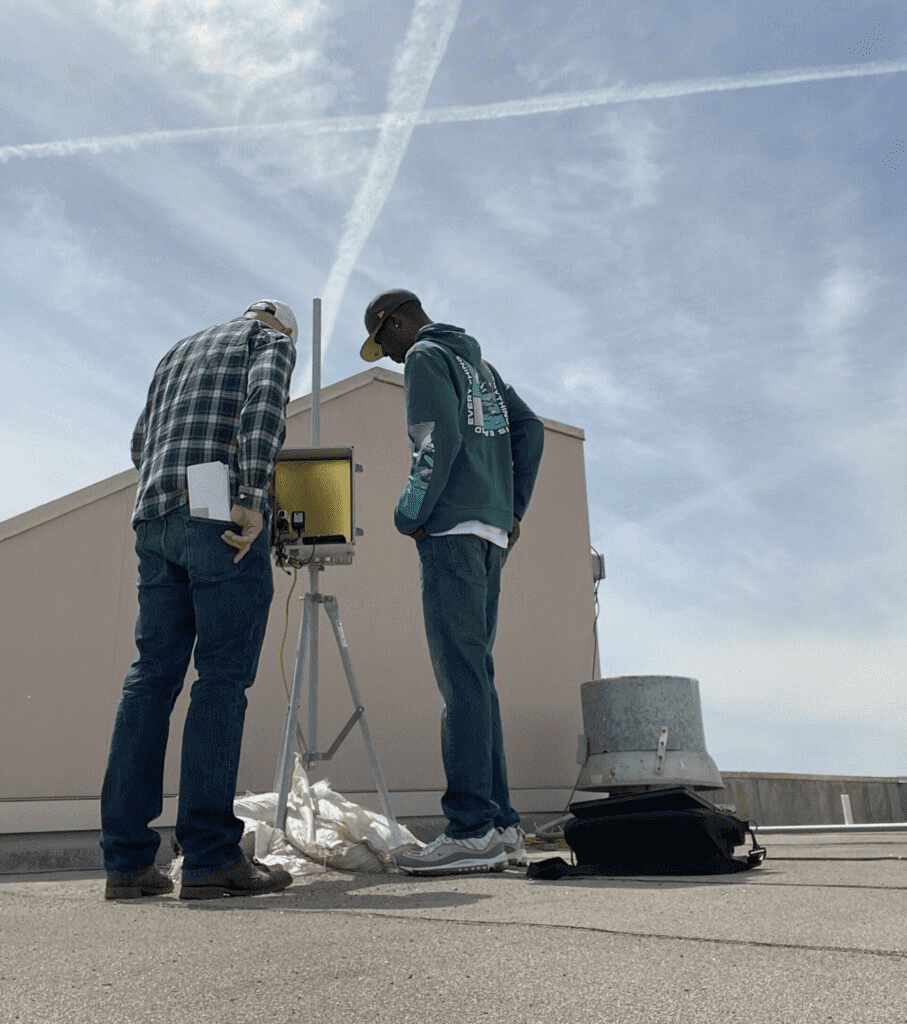
East Oakland Community Air Monitoring Partnership
We launched a three-year community air monitoring project in partnership with Communities for a Better Environment (CBE) to characterize local-scale air quality impacts in East Oakland supported by a U.S. EPA American Rescue Plan Enhanced Air Quality Monitoring for Communities Grant. We will work with CBE to design and implement air monitoring to assess the impacts of sources or areas of interest to the community. Air quality data from local pollution sources in overburdened communities and the effectiveness of exposure reduction measures can help inform our programs.
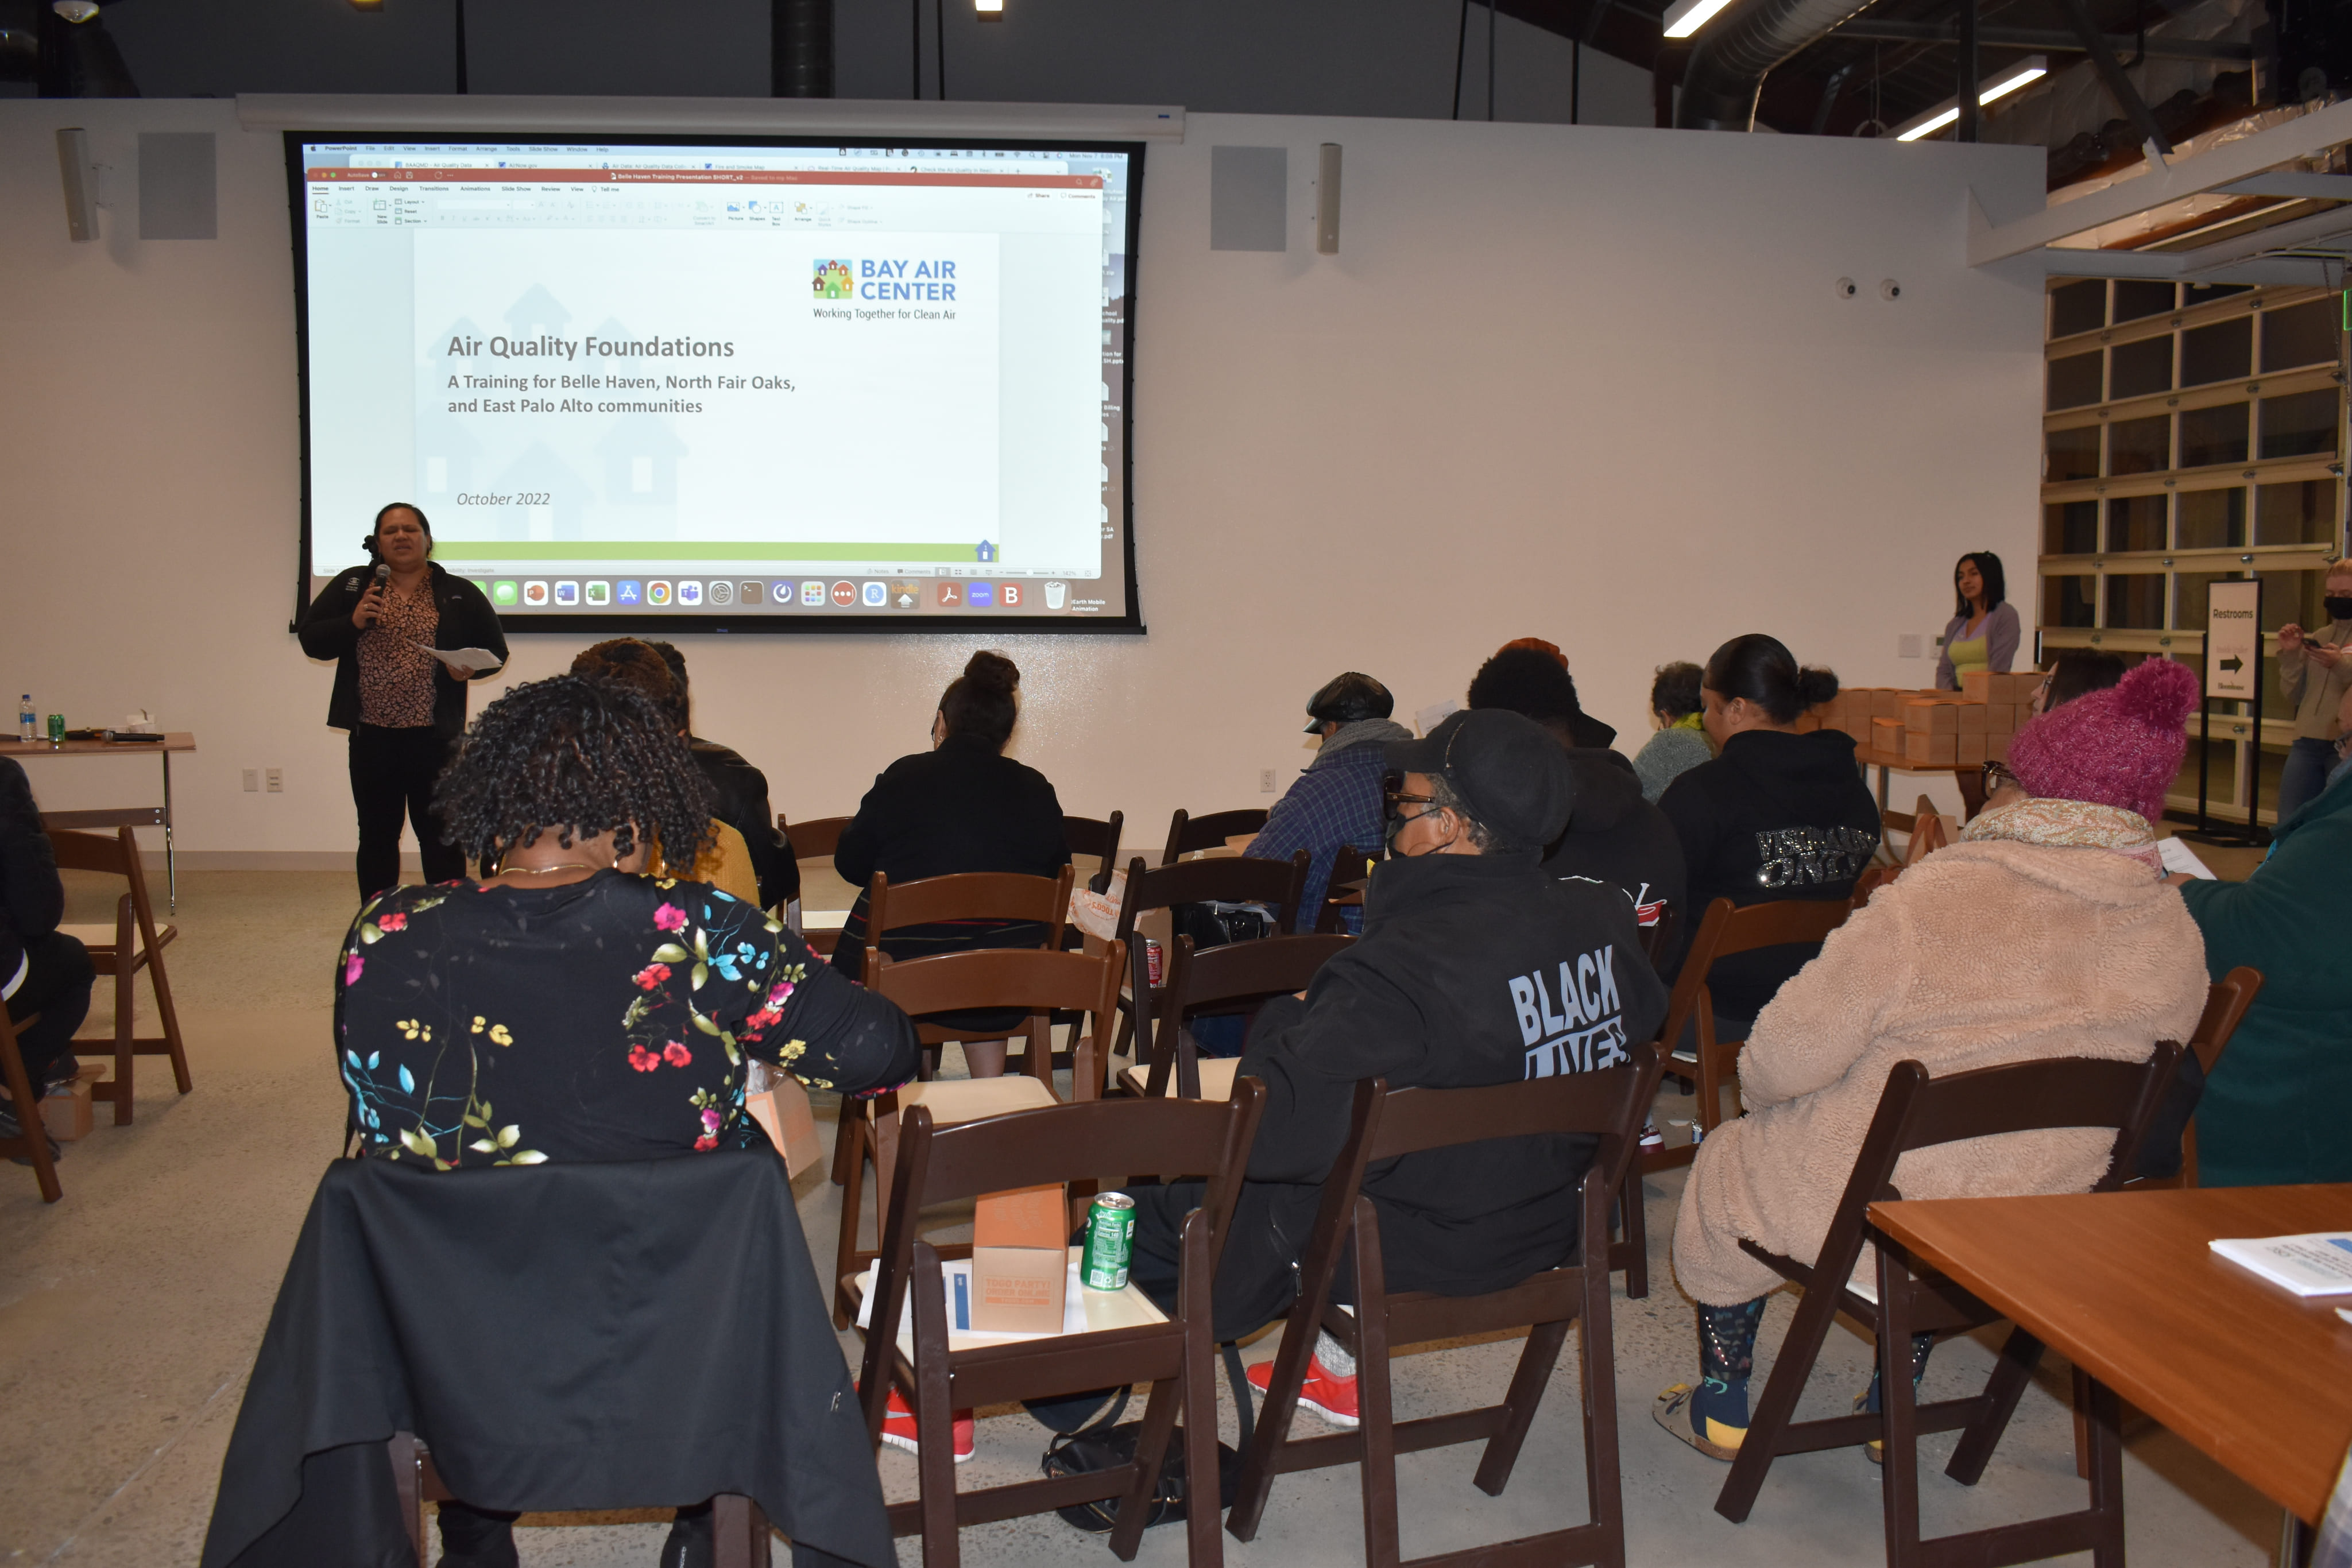
Bay Air Center Launches Public Website
We sponsored the Bay Air Center as a resource that offers technical guidance, materials, and training on air monitoring and air quality data for community-based organizations, with the goal of supporting their efforts to understand and improve air quality. The website provides detailed information on the program, a way to request support, and an extensive resource library that includes materials developed by the Bay Air Center as well as external links to materials that cover a variety of air quality-related topics.
AD HOC COMMITTEE ON INCIDENT RESPONSE PROGRAM IMPROVEMENTS
Our Board of Directors formed an ad hoc committee to strengthen our incident response program through increased coordination with our government and community partners. The committee identified ways to provide information more quickly to the public when an incident occurs, including our methods of response and potential impacts on air quality. The ad hoc committee has also discussed opportunities to fill gaps in monitoring, which will be considered as part of upcoming strategic planning and budget processes.
LABORATORY
2023 Analyses Performed in the Lab*
Particulate Matter
3,988
Toxics
1,118
Source-Oriented Analyses
41
Interagency and Development Projects
0
Total
5,147
*Samples provide information about pollutant levels in ambient air, which help to identify areas for further reductions.
EXCEEDANCES OF AIR QUALITY STANDARDS
OZONE
Days over National 8-Hour Standard
4*
Days over California 1-Hour Standard
0*
Days over California 8-Hour Standard
4*
PARTICULATE MATTER
Days over National 24-Hour PM10 Standard
0*
Days over California 24-Hour PM10 Standard
0*
Days over National 24-Hour PM2.5 Standard
3*
*Pending final certification
Final certification of exceedance data will occur in June 2024.
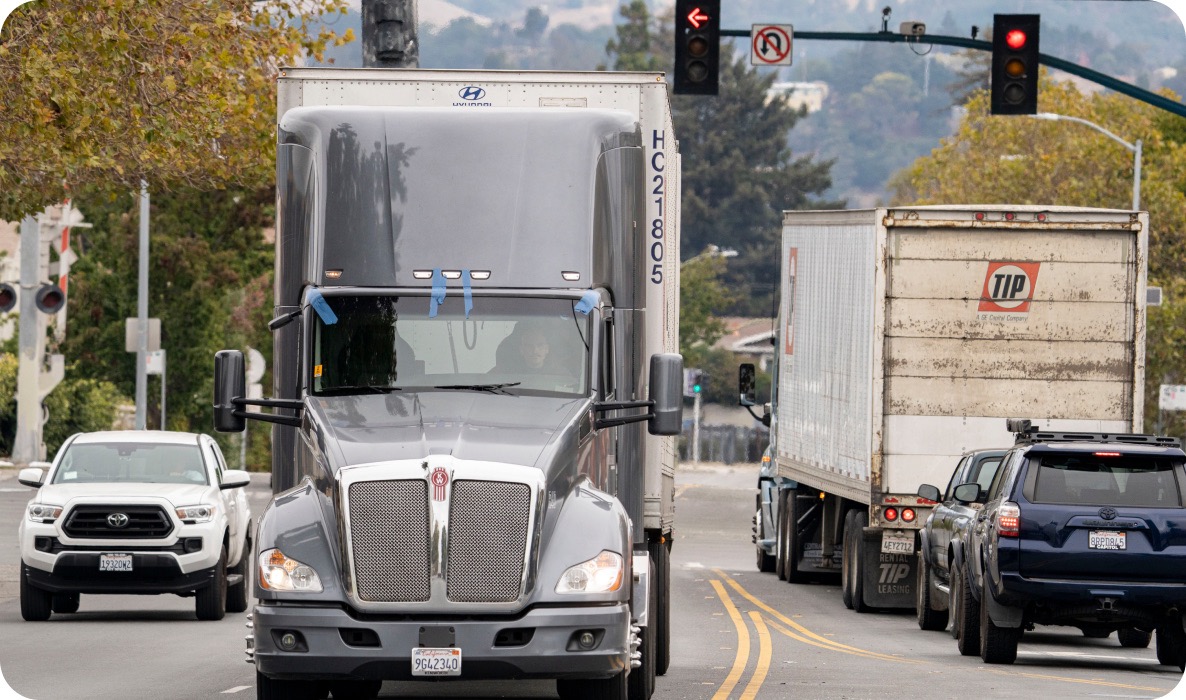
Bay Area Pollution Sources
SOURCES OF GREENHOUSE GAS EMISSIONS a
SOURCES OF ANNUAL FINE PARTICULATE POLLUTION d
SOURCES OF ANNUAL NITROGEN OXIDE POLLUTION d
a The Air District’s latest greenhouse gas (GHG) emissions estimates can be found here: baaqmd.gov/capghg. These estimates do not reflect specific emissions changes in 2023 due to the impact of COVID-19 pandemic or wildfires.b This category includes GHG emissions from refining processes and combustion of gas, liquid and solid fuels at refineries; it does not include GHG emissions generated during cogeneration at refineries, which is included in the Electricity/Co-Generation category.c This category includes GHG emissions from combustion and processes at cement plants, natural gas combustion, combustion of solid and liquid fuels in industries, natural gas distribution fugitive losses (primarily methane), and industrial process emissions.d These percentage estimates are developed based on the Air District’s currently available regional inventory data. These estimates do not reflect specific emissions changes in 2023 due to the impact of COVID-19 pandemic or wildfires.e This category includes wind-blown dust from agricultural land and dust from construction operations.f This category includes construction and mining equipment, agricultural equipment, industrial and light commercial equipment, and airport ground support equipment, etc.g This category includes trains, lawn and garden equipment and other off-road equipment.h This category includes passenger cars, buses, motorcycles, etc.