Building
EQUITY
in Air Quality
scroll to begin

Community
health
protection
Program
as part of statewide efforts to implement assembly bill 617, the air district continued to work in collaboration with community members and other stakeholders to implement health protective measures in communities highly impacted by air pollution.
community health protection program
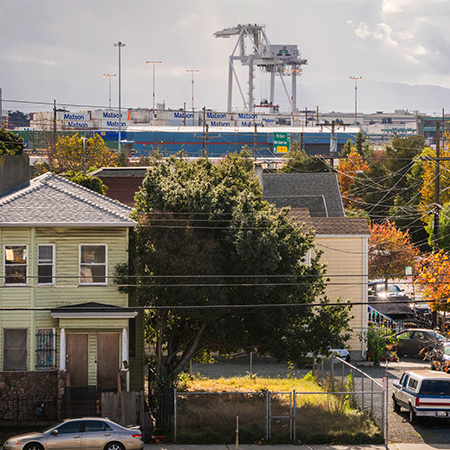
Implementation of the West Oakland Community Action Plan focused on active transportation — such as biking and walking — improving transit access, harmonizing land use, reducing the impact of port and freight operations, and increasing health programs and green spaces to reduce air pollution. Based on training from City of Oakland staff, the Steering Committee is applying racial equity analyses to strategy priorities and implementation.
community health protection program
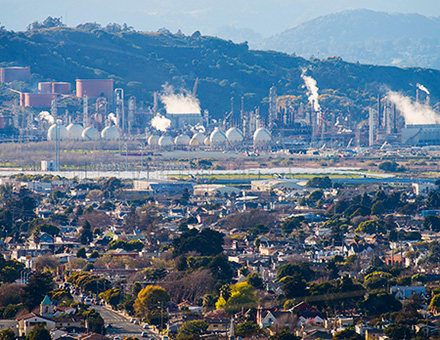
The Richmond-North Richmond-San Pablo Path to Clean Air expanded to a Community Emissions Reduction Program. A community steering committee will partner with the Air District to prioritize and select strategies to reduce emissions from local sources and mitigate exposure to air pollution. As part of the Path to Clean Air, a Monitoring Outreach Team working with the Air District continued to prepare and review public-facing updates on air monitoring projects.
community health protection program
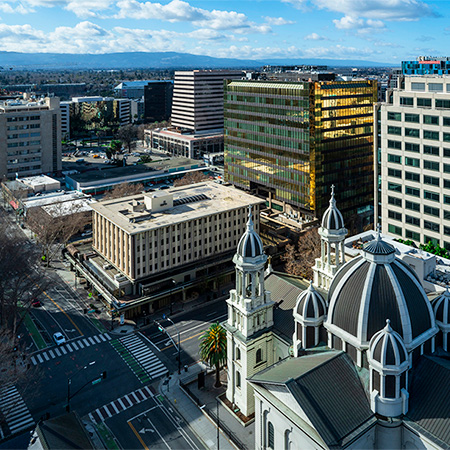
Efforts will continue in the AB 617 high priority communities of eastern San Francisco, East Oakland and San Leandro, Vallejo, East Contra Costa County, the Tri-Valley area and San Jose. These efforts include community data collection, emissions inventories, modeling impacts from fine particulate pollution and toxics, providing funding incentives for emission reductions, and continuing to support leadership development through community grants.
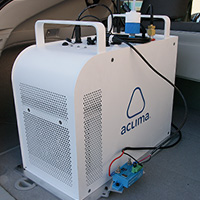
Hyper-Localized
Mobile Air
Monitoring Program
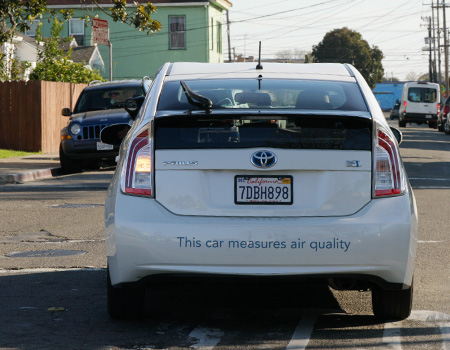
in january, the air district and aclima announced the roll-out of a cutting-edge air quality data program that will map air pollutants and greenhouse gases in every bay area neighborhood — covering more than 5,000 square miles.
Fleets of low-emission vehicles equipped with air quality sensing devices and software will collect, analyze and map air pollution and greenhouse gas levels as they drive on Bay Area roads. The data will plot block-by-block average concentrations of air pollutants over a year – such as fine particulates, ozone, nitrogen dioxide and greenhouse gases. This high-resolution picture of air quality will show air pollution hot spots, enabling more targeted follow-up studies and emissions reduction efforts.
Partnership on
Database
Development
Through an interagency Partnership Agreement, the Air District is leveraging the Metropolitan Transportation Commission’s data management expertise to support increasingly complex database and project assignments, including support for the AB 617 Community Health Protection Program. A critical element of effective agency collaboration is shared datasets, an element facilitated by this agreement to produce consistent and coordinated methods for database development, documentation and online publishing.
Technical
Assistance
for Communities
the air district established the bay air center, a support and knowledge-sharing resource for community organizations on technical air quality topics, including data analysis and low-cost air quality sensors.
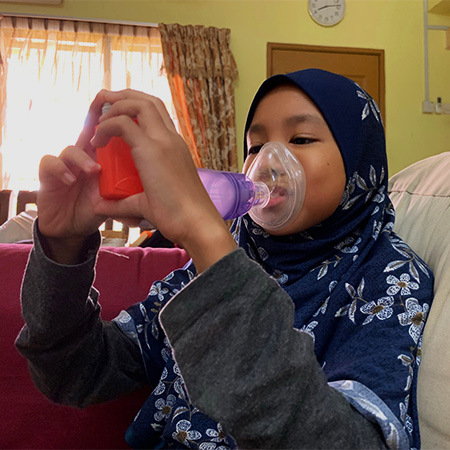
Green and
HEALTHY HOMES
Initiative
through a partnership with contra costa county, the air district is reducing greenhouse gas emissions and improving indoor and outdoor air quality for high-risk asthma patients.
The Green and Healthy Homes Initiative is an innovative collaboration with partners from government agencies, the private sector and community-based organizations to improve health outcomes and protect the climate. The program will implement and monitor improvements in the homes of select high-risk asthma patients across the county to improve indoor air quality, remove underlying asthma triggers and reduce GHG emissions. Improvements will include air filtration and dehumidification, ventilation, electrical upgrades, electrification of air systems and appliances, induction cooking and energy efficient appliances.
Climate and Food
Program
the food we eat has tremendous impacts on both our health and the health of the planet. The world’s food system accounts for nearly one-quarter of annual greenhouse gas emissions, from crop and livestock production to food processing and distribution and food waste. In 2020, the Air District partnered with Acterra to produce a webinar series to promote plant-based diets. The series featured the documentary, The Invisible Vegan, that explores unhealthy dietary patterns in the African American community. It also included Holiday reFresh, a program of live cooking demonstrations by popular Bay Area chefs preparing seasonal, plant-based meals representing diverse cultural backgrounds.

Ad Hoc Committee on
Equity, Access
and inclusion
The Air District Board of Directors approved the formation of an Ad Hoc Committee – renamed the Community Equity, Health and Justice Committee in early 2021 – to address environmental justice, inequities in health outcomes, and economic opportunities in Bay Area communities disproportionately impacted by air pollution. The Committee will prioritize traditionally marginalized and disinvested communities in Air District policies and programs.
Air District Board
Adopts resolution
Condemning Racism
On June 17, the Air District’s Board of Directors unanimously adopted a resolution condemning racism and injustice and affirming the agency’s commitment to diversity, equity, access and inclusion in its policies, programs and practices. Institutional racism is ingrained in the American system of government. The Air District firmly recognizes the inherent dignity of all individuals and is committed to eradicating barriers to opportunities in communities disenfranchised by government.
Building Equity in Air Quality
Demographics by GENDER

Demographics by RACE/ETHNICITY

Sources of Bay Area Pollution

- a. The Air District’s latest greenhouse gas (GHG) emissions estimates can be found here: baaqmd.gov/capghg. The Air District has recently collected methane measurements that indicate corrections are needed for some of these source contributions. Staff are reviewing GHG estimates to improve consistency with the measurements.
- b. The percentage estimates were developed based on the Air District’s currently available base year inventory data (see baaqmd.gov/emissioninventory). These estimates do not reflect specific emissions changes in year 2020 from the COVID-19 shelter-in-place and wildfires.
Sources of Bay Area Pollution

- b. The percentage estimates were developed based on the Air District’s currently available base year inventory data (see baaqmd.gov/emissioninventory). These estimates do not reflect specific emissions in year 2020 from the COVID-19 shelter-in-place and wildfires.
- c. The Air District is in the process of updating the base year inventory to reflect changes in recent state and local regulations and emissions data.
- d. The category includes aircraft, ships, trains, construction equipment and other off-road equipment.
Sources of Bay Area Pollution

- b. The percentage estimates were developed based on the Air District’s currently available base year inventory data (see baaqmd.gov/emissioninventory). These estimates do not reflect specific emissions changes in year 2020 from the COVID-19 shelter-in-place and wildfires.
- c. The Air District is in the process of updating the base year inventory to reflect changes in recent state and local regulations and emissions data.
- d. The category includes aircraft, ships, trains, construction equipment and other off-road equipment.


